GPS Chipset Shootout

Is there any differences between GPS Chipsets? How accurate are they?

October, 2010


Introduction

Increasingly, we are relying on GPS systems to guide us in our lives. Whether this be navigation in a vehicle, on a bike, or for bushwalking/geocaching, we are relying on GPS more than ever to provide us the "correct" current location. Sometimes, even, lives are at stake. GPS is also increasingly used for timing in scientific experiments, and synchronizing different areas of the power grid. As many manufacturers jump on the GPS bandwagon to provide location services to an increasing number of mobile devices, GPS will become a increasing part of our daily lives - for example, geotagging photos. Most of the time, however, a consumer will buy themselves a GPS unit that has all the features they need - but what about its positioning performance? It's difficult to tell just by looking at a device to know how it will perform in reality.

One of the most important determining factors of the GPS positioning system (from the user end) is the chipset that is used. The chipset contains all the brains to perform the positioning fix itself, including algorithms for searching, locking onto signals, smoothing out variations and providing a position which can be used by the software. Commonly, a NMEA data stream is produced from the GPS chipset directly, and read into the software as input. Most of the intelligence that goes into processing the signal and producing a fix is hidden from the user and the application, and is fixed at the point of chipset design. With differing chipsets comes differing performance and sometimes, even strange bugs.

That is to say, the chipset is not the only important part in a GPS system - the antenna plays an important role as well as the software which processes the data. The antenna must have a good circular polarization with enough gain to allow for good capture of the weak signals from the GPS satellites in difficult conditions, while reducing pickup of reflected signals which can cause receivers to lose lock or jump about. The software has to make sense of all of the data. Even things such as power supply and other components in the immediate vicinity have an impact on the GPS system - if they radiate significant harmonics and or radio noise in the L1 band, they could raise the noise floor and wipe out the signals.

Because of the intricacies of this, it isn't really possible to objectively test and quantify which GPS is indeed better - some may be optimized for navigation use in a car and may perform better under difficult conditions, while performing poorly in a stationary application. This "report" isn't really intended to conclude which is the best chipset - but just to give people an idea about the variances that can be expected whenever we rely on GPS for our position.

Just where are we now?

It's a difficult question to answer - just where are we now? Unfortunately, I don't have easy access to a surveyed location which has known co-ordinates. So instead, we will be focusing on relative accuracy - and repeatability. That is to say - if we got here by GPS, and recorded the co-ordinates, just how close will I get if I asked someone else with a GPS to go to those same co-ordinates. Unsurprisingly, that someone else won't end up in the exact same position as there are errors in the way position is determined that will cause the co-ordinates to appear to "drift".

The GPS system works simply by comparing arrival times of signals broadcasted simulatenously by orbiting satellites. By working the time difference of arrival, a solution can be found where many of the signals would "coincide" in space in that one point. A GPS receiver just keeps altering its position until it gets the closest match. I know this is an overly simplified explanation, but it should suit most people. Unfortunately, signals don't just travel in a straight line at a constant speed - there are delays caused by passing through layers of the atmosphere (ionosphere) that cause signals to be bent and travel longer paths, or become corrupted. Signals can be reflected by solid objects much closer to the reciever and this would cause what is known as multipath. There are also errors due to the timing accuracy of the satellite clocks (tiny!) and the receiver clock (much more significant). There are also variables such as the positioning of the satellites which can, through geometrical effects, change the level of precision as well. All of these errors pevent us from finding a perfect position.

But suppose we average the result for long enough - it is possible to get a better estimate of the present location with the assumption that over a long enough time, these errors, which appear as noise, will cancel out. This approach is a possible approach - but then again - how do you know there is no bias in the error? It's a tricky thing to find the "true" location of some place ... it's a wonder how people define an "exact" position in the first place. Depending on how accurate you need to know your location, a "consumer" GPS may or may not be accurate enough

Method

In this shootout, I have used four GPS units. Most of them are brandless, Bluetooth units - the chipsets are ATMEL Antaris 4, Nemerix, SiRF Star III and RF Microdevices to the best of my research ability. Keep in mind, the manufacturers of these no-brand GPS units may have done an internal chipset swap, and for most of these chipsets there are no identifying features of the data output that can be used to identify them (except SiRF due to a special SiRF mode which can be activated). (I do have a fifth unit with a Sony chipset, but I forgot to dig that out for this test. Maybe I'll do it another day.) All of the receivers were placed indoors, in my bedroom in the upper story of a two storey house. The test was performed with the GPS units stationary. All units were powered on and left for an hour to warm up and settle, download epheremis data and gain a 3D fix. They were all placed within 1m of each other in a square formation in order to provide enough separation to minimise interference while being at nearly the same location. They all were connected to the same computer, and a terminal program was used to log the raw NMEA data for a period of 3 hours and 50 minutes. The data was processed in the slow setting through a piece of software called VisualGPS. In order to keep my position anonymous, some of the position has been removed and replaced by x's. However, that being said - the data that is lost to x's are identical on all units (i.e. they are all showing the same figures). The results are seen below.

Results Summary

Statistic ATMEL Antaris 4 Nemerix SiRF Star III RF Microdevices
Mean Average Latitude xx degrees xx.x792 minutes xx degrees xx.x794 minutes xx degrees xx.x795 minutes xx degrees xx.x819 minutes
Mean Average Latitude Std Dev 2.364m 2.991m 4.361m 3.695m
Mean Average Longitude xxx degrees xx.x312 minutes xxx degrees xx.x317 minutes xxx degrees xx.x320 minutes xxx degrees xx.x330 minutes
Mean Average Longitude Std Dev 1.725m 1.933m 3.032m 2.369m
Mean Average Altitude 37.25m 32.82m 36.98m 38.22m
Mean Average Altitude Std Dev 5.186m 9.085m 12.660m 2.693m
Least Squares Average Latitude xx degrees xx.x782 minutes xx degrees xx.x791 minutes xx degrees xx.x788 minutes xx degrees xx.x806 minutes
Least Squares Average Latitude Std Dev 2.153m 2.978m 4.306m 3.478m
Least Squares Average Longitude xxx degrees xx.x323 minutes xxx degrees xx.x327 minutes xxx degrees xx.x323 minutes xxx degrees xx.x326 minutes
Least Squares Average Longitude Std Dev 1.484m 1.745m 3.027m 2.349m
Least Squares Average Altitude 37.44m 32.67m 37.87m 35.99m
Least Squares Average Altitude Std Dev 5.184m 9.083m 12.645m 2.366m
HDOP less than or equal 1.0 45.7 percent 47.1 percent 25.2 percent 48.4 percent
HDOP greater than 1.0 but less than or equal to 2.0 54.1 percent 52.7 percent 69.4 percent 49.7 percent
HDOP greater than 2.0 0.3 percent 0.1 percent 5.4 percent 1.9 percent


First of all, it is nice to see that they all agree about my position to a tenth of a minute in both latitude and longitude. From there, they have slightly different ideas. The most informative is to look at the Standard Deviation figures - from elementary stats, the 68-96-99.7 rule comes to mind - so you can be 99.7% sure that your true location is within 3 standard deviations of the "mean" (which is the figure reported, averaged over 3 hours and 50 minutes of collection). However, this assumes that the position error is normally distributed. Note that there are two means - the software reports the arithmetic and the geometric mean, hence two different SD's as well.

So by looking at the SD's, we can tell that for latitude and longitude positions, all units seem to be able to meet the 15 meter advertised accuracy at the 99.7% level. That's a good sign! However, a look at the altitude readings show that it is significantly less reliable with the SD's quite large - note the SiRF which reports a 12.6m SD! So for altitude, no good!

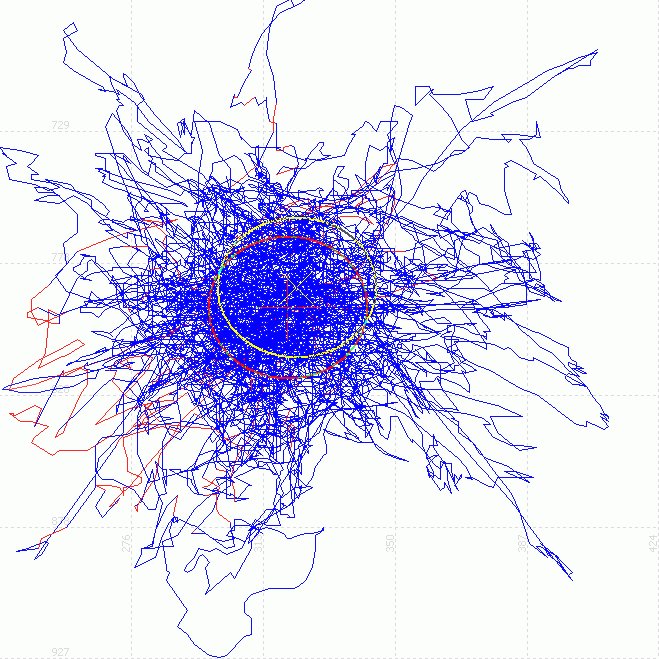
It's also interesting to take a look at the HDOP data which is provided - the SiRF Star III seems to have a much poorer accuracy level which is unusual. Most people report the SiRF as being one of the better chipsets, but in this bunch, it seems that it's not performing as well as I would have expected - it's level of DOP was higher than all the others. This might be because this was USB powered and there was some noise on the USB cable, or a bad integrated antenna.

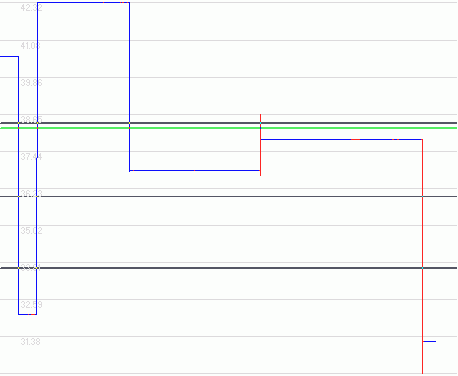
So far, I would say that the Nemerix is my favourite of the group. The Antaris suffered quite a long wait till first fix - about half an hour since the internal almanac backup battery went flat. But then, all of the GPS units haven't been used in half a year, so they would all have lost the almanac anyway! Note the RF Microdevices seems to show suspiciously good figures for some of the readings - especially altitude ... a quick look at the plots below should make the reason apparent!

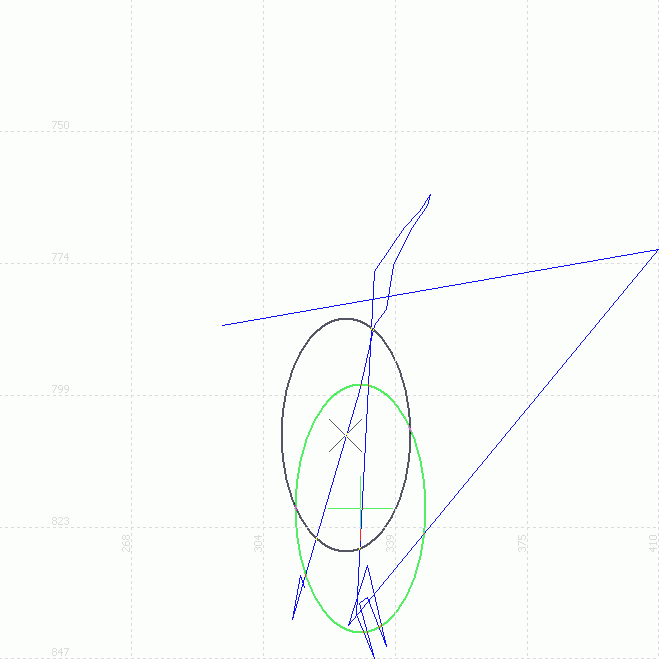
Track Plots

ATMEL Antaris 4 Chipset


Nemerix Chipset


SiRF Star III Chipset


RF Microdevices Chipset


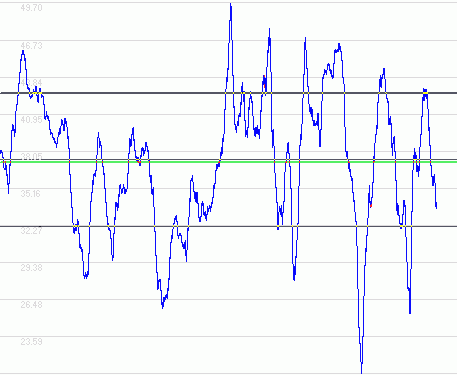
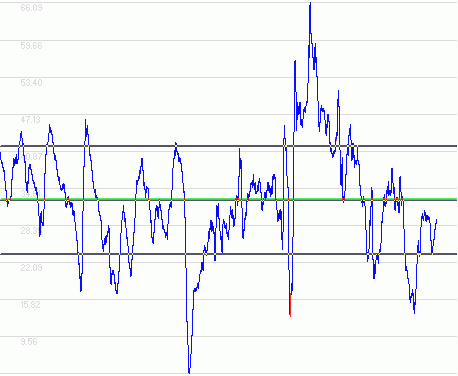
Altitude Plots

ATMEL Antaris 4 Chipset


Nemerix Chipset


SiRF Star III Chipset


RF Microdevices Chipset


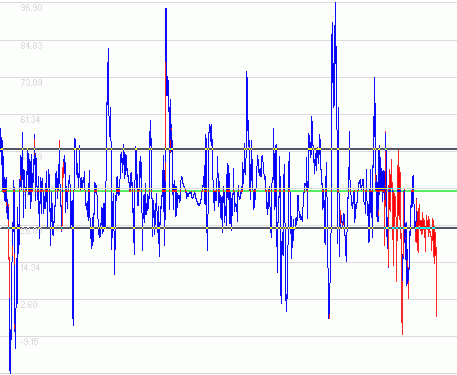
Those plots should have raised eyebrows! They certainly raised mine - see the RF Microdevices chipset is doing something funky - it doesn't update its position at all for a lot of the period and its altitude changes "stepwise". Definitely not what you would expect in reality seeing what the other chipsets do. This is possibly because it's been silently designed for navigation - and so it filters out small random movements below a certain threshold to prevent confusing GPS navigation software. Some will call this a feature, but I would call this a "bug".

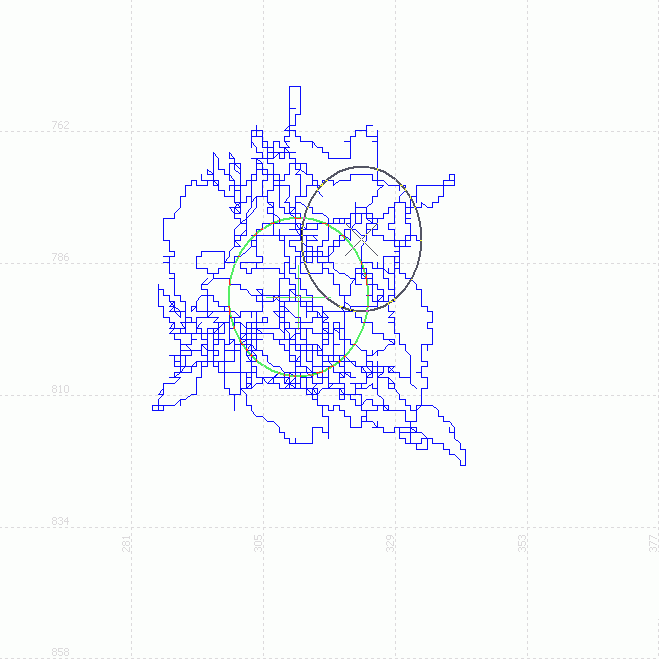
A quick look at the SiRF's data says that it's pretty raw and all over the place - but that's probably what real data is like. Noisy. Notice the spikes in altitude and it ranges from sub -10m to a peak of almost 97m - and the plot looks like a child doodled all over a piece of graph paper. I actually trust this more - note the arithmetic and geometric mean circles overlap significantly as well.

The Nemerix and the Antaris, however, shine in this test. The blockiness of their plots imply a smoothing algorithm inside which basically forces movements to be made a step at a time - that graph is scaled so that each "square" is the minimum reportable change in co-ordinates - a ten-thousandth of a minute. It doesn't wander very far - the Antaris looks like it's got itself in a nice patch. But is that really what is being received? Probably not ...

You might wonder why these plots don't have the same error trends - especially say in altitude vs time. Surely by observing the same satellites, they should come up with similar results? Well, a quick look at the Antaris and Nemerix plots show a similarity in the trends. Not so much with the SiRF. The main reason is, while all these signals are available and sent from all the satellites at the same time, it's up to the software inside the GPS receiver (and the chipset design) to decide which signals, and how many of them are used to compute a solution. By using different signals, with different levels of error in each, you can expect a different answer - even if you had two consumer GPS units side by side, chances are they will not give you the same solution.

Conclusion

So, by looking at all this data, we can conclude that there are differences in accuracy between different GPS units, and that their chipsets contribute significantly to the type of data we can see at the output. Different algorithms and interpretations of the signals result in different levels of error and observed "drift" in the co-ordinates. We have (sort of) verified that all GPS units here can meet the claimed accuracy of 15m - with some units doing better than others. We have shown that the altitude error is greater than that of the longitude/latitude error. Also, we have shown that all tested GPS units agreed to a tenth of a minute on a single sample without averaging.

Want to try this yourself?

As most at-home scientists would, they would like to try it themselves. And you can, as long as you have a GPS receiver unit that is connected to a COM (serial) port. Download a piece of software called VisualGPS from here for Windows, install it, select the correct COM port and you'll be off and running to producing plots and figures as seen above. Then you can compare your own devices and reach your own conclusions. It is best to leave it running for a while to gather data - most consumer grade GPS units will produce one sample per second. The plots I made above were made from about 14000 samples which is about 4 hours of run time. Keep in mind, you should compare all your GPSes at the same time to try and remove the factors of changing propagation conditions, and site them near to each other so that they "see" the same conditions, while at the same time, not being too close so that the GPS units don't interfere with each other. It's an imprecise science "done at home" but it does demonstrate that there are clear differences between different units.